Adding reproduction and extra features to the agents
This tutorial will show you how to expand the sugarscape simulation created previously to have agent reproduction and additional features.
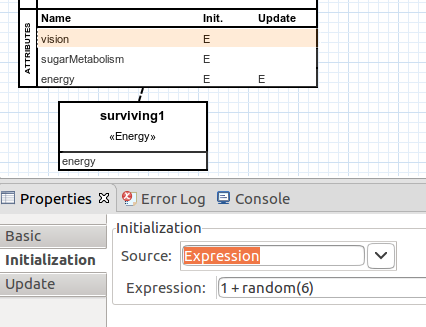
Start by modifying the field of vision attribute of the agent.
On the properties view, change to the "Initialization" tab and modify the field "Expression" to "1 + random(6)".
Now the field of vision value will vary between 1 and 6 for each agent. The resulting "Initialization" tab will look like Fig. 1.
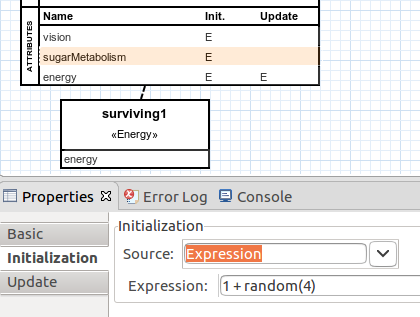
Now let's change the metabolism attribute of the agent.
On the properties view, change to the "Initialization" tab and modify the field "Expression" to "1 + random(4)".
Now the metabolism value will vary between 1 and 4 for each agent. The resulting "Initialization" tab will look like Fig. 2.
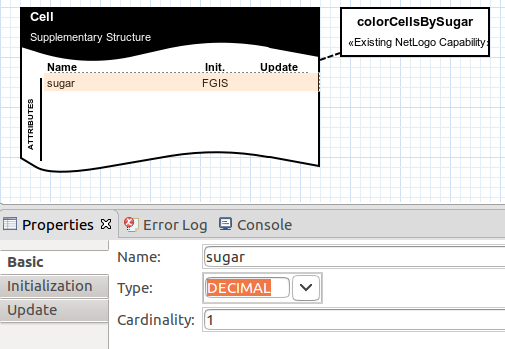
Now let's change the sugar attribute of the supplementary structure to allow the sugar to reappear on the map after a certain amount of time.
On the properties view, on the "Basic" tab, modify the field "Type" to "DECIMAL". The resulting "Basic" tab will look like Fig. 3.
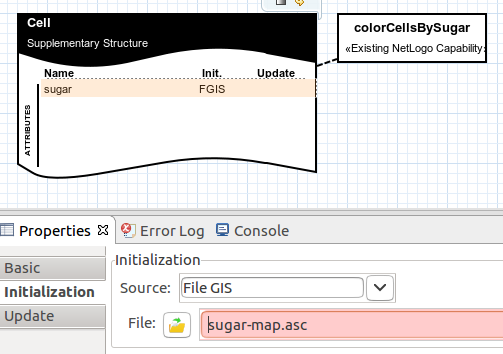
Now change to the "Initialization" tab and modify the "Source" field to "File GIS".
Load a file to define the cells on the map where the sugar will appear and the quantity of sugar available on each cell.
Click on the file button that appeared, a new window will pop up. Select the file to use. In this case, select the "sugar-map.asc" file available to download on the following webpage.
www.inf.ufrgs.br/prosoft/projects/mdd4abms/eclipse/files/
After choosing the file, the resulting "Initialization" tab will look like Fig. 4.
Now add a supplementary attribute to make the sugar reappear on the map after being depleted.
Select an attribute to add, by clicking on the Entities > "Attribute" line on the palette and clicking on the supplementary structure box.
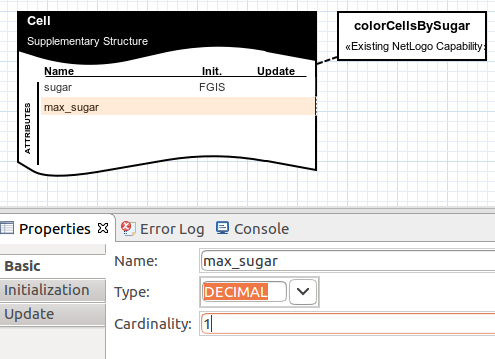
You can select the attribute created. On the "Basic" properties view that appeared, change the attribute name to "max_sugar", and its type to "DECIMAL".
The resulting attribute will look like Fig. 5.
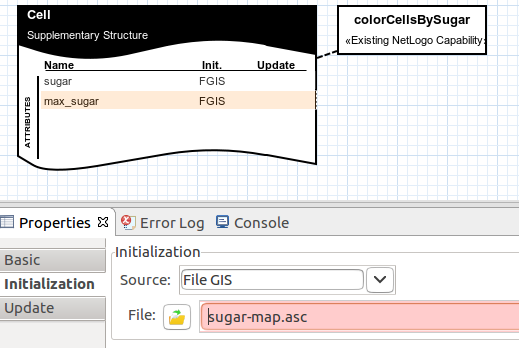
Now change to the "Initialization" tab and modify the "Source" field to "File GIS".
Load a file to define the cells on the map where the sugar will reappear and the new quantity of sugar available on each cell.
Click on the file button that appeared, a new window will pop up. Select the file to use. In this case, select the same "sugar-map.asc" file available to download on the following webpage.
www.inf.ufrgs.br/prosoft/projects/mdd4abms/eclipse/files/
After choosing the file the resulting "Initialization" tab will look like Fig. 6.
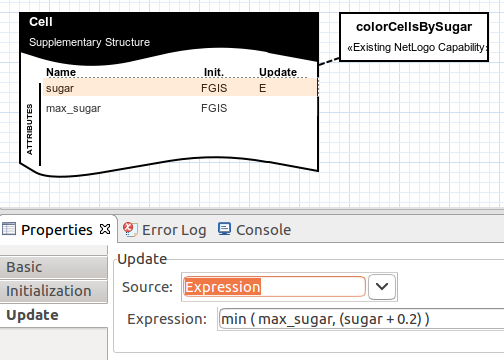
Select the sugar attribute again and change to the "Update" tab.
On the field "Source" select "Expression". Set the field "Expression" that appeared to "min (max_sugar,(sugar + 0.2))".
Now the sugar values on the map will update on each step of the simulation. The resulting "Update" tab will look like Fig. 7.
Now create a new type of movement for the agents. They will move to the nearest cell with sugar instead of moving to any random cell on the map like before.
First, remove the previous random walk mobility.
Move the mouse pointer to the mobility box and select the trash can icon that appeared.
Confirm to delete the box from the diagram.
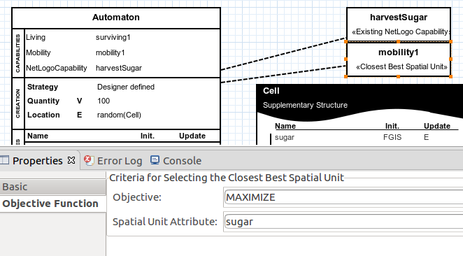
Select the new mobility to add, by clicking on the Mobility > "Closest Best Spatial Unit" line on the palette and clicking on the agent box.
A new box will be added to the diagram connected to the agent.
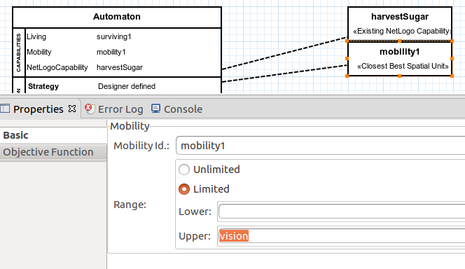
Like before the agents must be able to move to the limits of their field of vision on each step of the simulation.
To do this, on the properties view that appeared, tab "Basic", "Range" rectangle, check the "Limited" dot and on the "Upper" field select the "vision" attribute.
The resulting "Basic" properties view will look like Fig. 8.
Now change to the "Objective Function" tab and set the "Objective" field to "MAXIMIZE".
The agents will prioritize moving to the cell on their field of vision that has the highest amount of sugar.
On the same tab, on the "Spatial Unit Attribute" field, select the "sugar" attribute modified previously.
The resulting "Objective Function" properties view will look like Fig. 9.
Now add a graphic to monitor the average field of vision and metabolism of the agents at each step of the simulation.
To add the graphic, select one to add, by clicking on the Output > "Output Dataset" line on the palette and clicking anywhere on the diagram.
You can select the box created. On the properties view that appeared, focus on the left column.
You can choose a name to give to the graphic on the "Name" field. Inside the output rectangle, click on the "+" button.
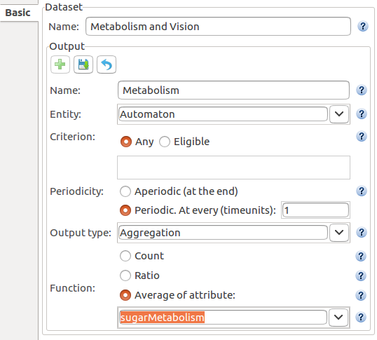
On the "Name" field, choose a name to identify the line to be added to the graphic. Let's call the first line "Metabolism".
Also, choose the entity related to the defined line. On the "Entity" field select the agent created previously.
Also, on the bottom of the column, check the "Average of Attribute" dot. Choose the "sugarMetabolism" attribute on the combo box.
Click on the floppy disc button to save the changes.
If you select the line created on the right column of the properties view and click on the pencil button, the resulting left column will look like Fig. 10.
On the left column, click on the "+" button again.
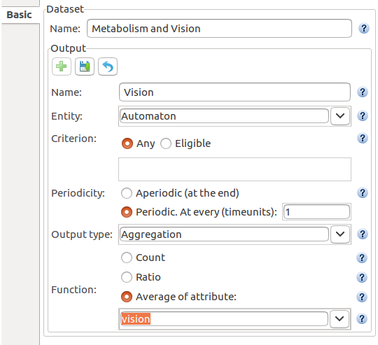
On the "Name" field, choose a name to identify the next line to be added to the graphic. Let's call the second line "Vision".
Also, choose the entity related to the defined line. On the "Entity" field select the agent created previously.
Also, on the bottom of the column, check the "Average of Attribute" dot. Choose the "vision" attribute on the combo box.
Click on the floppy disc button to save the changes.
If you select the line created on the right column of the properties view and click on the pencil button, the resulting left column will look like Fig. 11.
Now add a histogram to monitor the metabolism of the agents at each step of the simulation.
To add the histogram, select one to add, by clicking on the Output > "Output Dataset" line on the palette and clicking anywhere on the diagram.
You can select the box created. On the properties view that appeared, focus on the left column. You can choose a name to give to the histogram on the "Name" field. Inside the output rectangle, click on the "+" button.
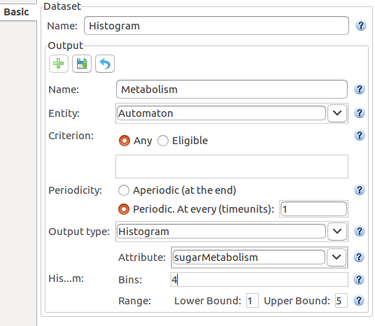
On the "Name" field, choose a name to identify the attribute to be monitored.
Also, choose the entity related to the histogram. On the "Entity" field select the agent created previously.
On the "Output Type" field choose "Histogram". On the "Attribute" field choose the "sugarMetabolism" attribute.
Set the "Bins" field to 4 and the "Range" field lower bound to 1 and upper bound to 5.
Click on the floppy disc button to save the changes.
If you select the line created on the right column of the properties view and click on the pencil button, the resulting left column will look like Fig. 12.
Add a final external capability, this time to allow the agents to reproduce.
To add the external NetLogo capability, select one to add, by clicking on the External > "Existing NetLogo Capability" line on the palette and clicking on the agent box.
A new window will pop up. Select the file with the NetLogo code corresponding to the capability to use. In this case, select the "reproduction-mdd4abms.nls" file available to download on the following webpage.
www.inf.ufrgs.br/prosoft/projects/mdd4abms/eclipse/files/
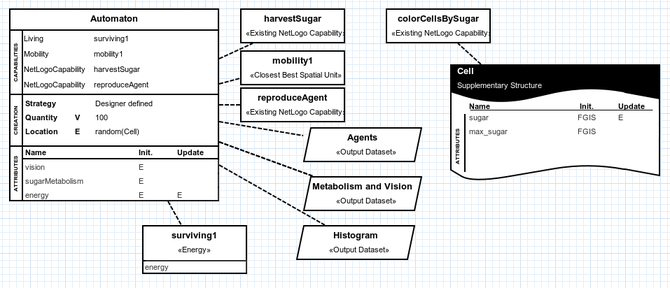
Fig. 13 shows what the entire concern diagram will look like after the changes made in this tutorial.
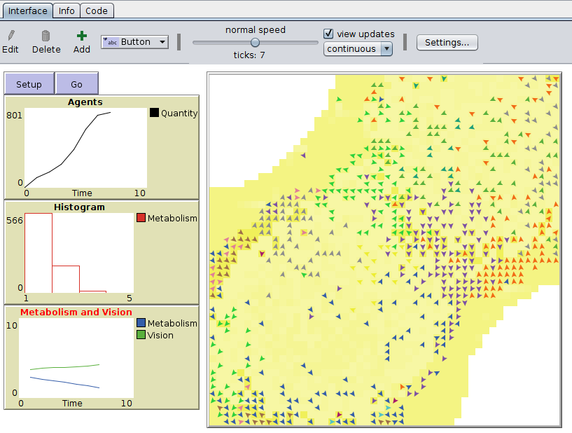
Now export and run the simulation on NetLogo, detailed instructions on the link: Exporting the Project to NetLogo. The simulation will look like Fig. 14.
The complete project created on this tutorial is available to download on the link below.