Adding energy to the agents
This tutorial will show you how to expand the initial version of the sugarscape simulation created previously, to help understand the ABStractme tool features.
First, add energy to the agents, which will be depleted with each step of the simulation.
If it reaches zero, the agent in question will die.
This energy can be replenished if the agent manages to collect sugar.
Start by adding the energy attribute to the agent. This attribute must be added in a different way than the previously created attributes.
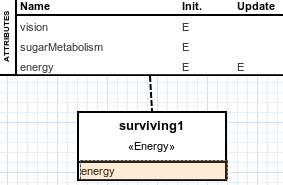
Select an energy to add, by clicking on the Surviving > "Energy" line on the palette and clicking on the agent box.
A new box will be added to the diagram, notice that it is connected to the agent.
The resulting box will look like Fig. 1.
Select the "energy" line on the new box created.
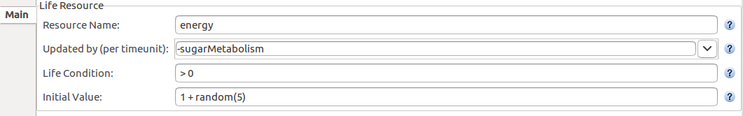
On the properties view, on the "Updated By" field, select the "sugarMetabolism" attribute previously created, edit the name to have a "-" before, like "-sugarMetabolism", as the metabolism will be decremented on each step.
On the "Life Condition" field, set the value to "> 0", as the agent will stay alive while this value is bigger than zero.
On the "Initial Value" field, set the value to "1 + random(5)", so that each agent will start with an energy value between 1 and 5.
The resulting properties view will look like Fig. 2.
Now create the sugar attribute to represent the sugar on the map. This attribute, however, is not part of the agent.
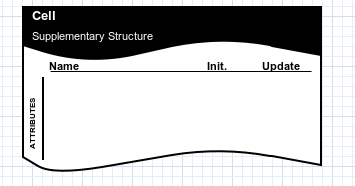
First, create a supplementary structure, select one to add, by clicking on the Entities > "Supplementary Structure" line on the palette and clicking anywhere on the diagram.
The created box will look like Fig. 3.
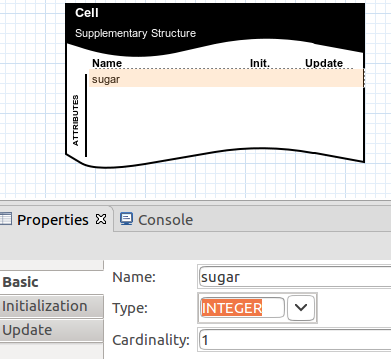
Now add the sugar attribute to the supplementary structure, select one to add, by clicking on the Entities > "Attribute" line on the palette and clicking on the supplementary structure box.
You can select the attribute created. On the "Basic" properties view that appeared, change the attribute name to "sugar" and its type to "INTEGER".
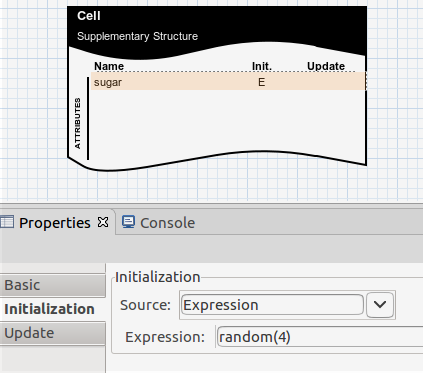
The resulting attribute will look like Fig. 4.
Change to the "Initialization" tab. On the field "Source" select "Expression".
Set the field "Expression" that appeared to "random(4)". The initial sugar value will be between 0 and 4.
The resulting "Initialization" tab will look like Fig. 5.
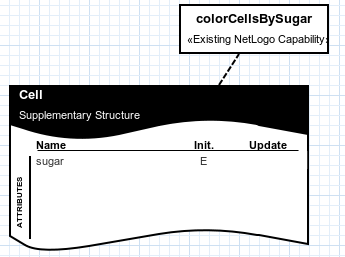
To make the sugar cells look yellow on the map, add coloring to them, this feature can only be added with an external NetLogo capability.
To add the external NetLogo capability, select one to add, by clicking on the External > "Existing NetLogo Capability" line on the palette and clicking on the supplementary structure box.
A new window will pop up. Select the file with the NetLogo code corresponding to the capability to use.
In this case, use the "color-cells-by-sugar-mdd4abms.nls" file available to download on the following webpage.
www.inf.ufrgs.br/prosoft/projects/mdd4abms/eclipse/files/
After choosing the file, the resulting created box will look like Fig. 6.
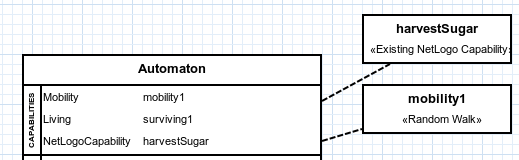
Add another external capability, this time to allow the agents to harvest the sugar.
To add the external NetLogo capability, select one to add, by clicking on the External > "Existing NetLogo Capability" line on the palette and clicking on the agent box.
A new window will pop up. Select the file with the NetLogo code corresponding to the capability to use.
In this case, use the "harvestSugar.nls" file available to download on the following webpage.
www.inf.ufrgs.br/prosoft/projects/mdd4abms/eclipse/files/
After choosing the file, the resulting created box will look like Fig. 7.
Also, add a graphic to monitor the number of agents alive at each step of the simulation.
To add the graphic, select one to add, by clicking on the Output > "Output Dataset" line on the palette and clicking anywhere on the diagram.
You can select the box created. On the properties view that appeared, focus on the left column.
You can choose a name to give to the graphic on the "Name" field. Inside the output rectangle, click on the "+" button.
On the "Name" field, choose a name to identify the line to be added to the graphic. Also, select the entity related to the defined line.
On the "Entity" field choose the agent created previously. Click on the floppy disc button to save the changes.
If you select the line created on the right column of the properties view and click on the pencil button, the resulting left column will look like Fig. 8.
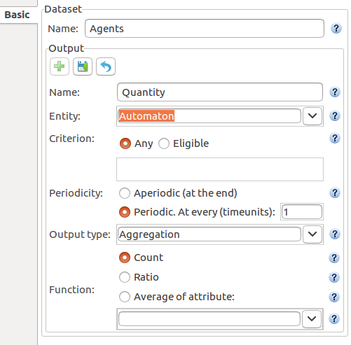
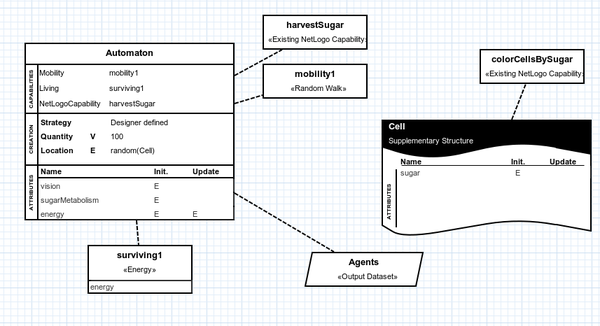
Fig. 9 shows what the entire concern diagram will look like after the changes made in this tutorial.
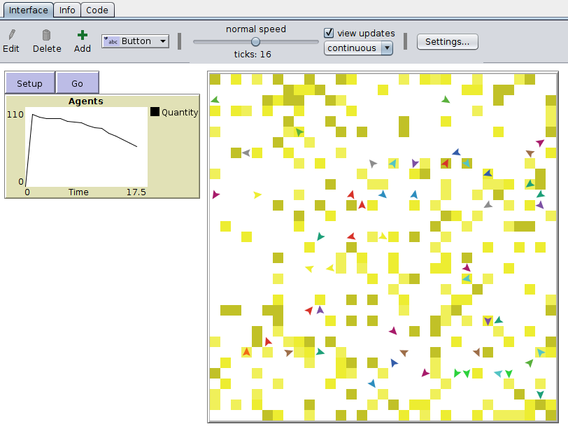
Export and run the simulation on NetLogo, detailed instructions on the link: Exporting the Project to NetLogo. The simulation will look like Fig. 10.
The complete project created on this tutorial is available to download on the link below.
Notice that the agents will die quickly once all the sugar is consumed. On the third part of this tutorial, the sugar will reappear after a certain amount of steps and a reproduction capability will be added to the agents: Adding reproduction and extra features to the agents.