Creating a sickness propagation simulation
This tutorial will show how to create a sickness propagation simulation to help understand the ABStractme tool features.
First create a new project and a new diagram, detailed instructions on the link: Creating the first project.
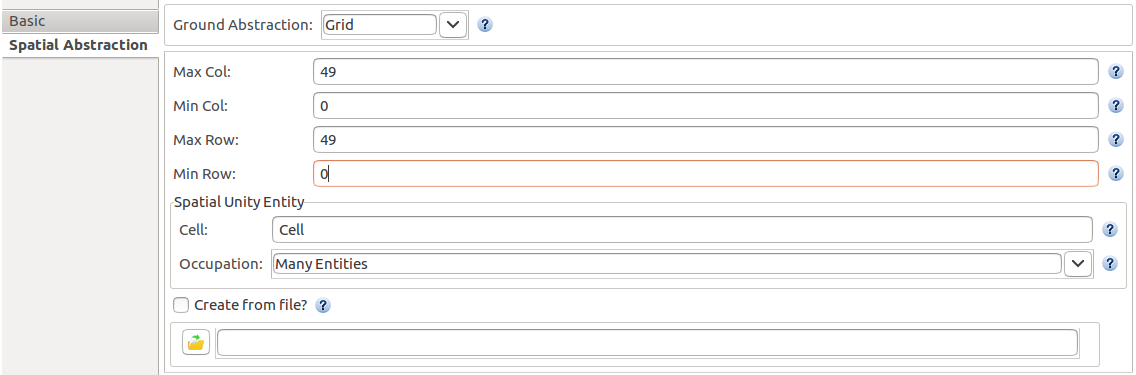
Open the diagram created, click on the overview box. At the properties view, select the "Spatial Abstraction" tab and change the fields "Max Col" and "Max Row" to 49. The grid will change to 50 x 50.
The resulting properties view will look like Fig. 1.
Now select the concern line on the palette and click on the overview rectangle.
A concern will be added to the overview along with its corresponding tab. Select the concern tab that appeared after the creation of the concern, a new window will appear with the concern diagram.
Add an agent to the concern. Select an agent to add, by clicking on the agent line on the palette and clicking anywhere on the concern diagram.
The agent box will appear on the diagram. Select the box. On the "Basic" properties view, the name of the agent can be set, in our case, its name will be "Human".
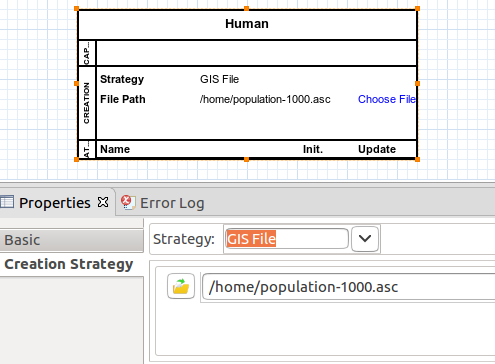
Change to the "Creation Strategy" tab, change the field "Strategy" to "GIS File".
Select a gis file to define how many and where the agents will be created, click on the folder button. A window to select the file will be opened. The file is available to download on the link below.
The resulting agent will look like Fig. 2.
Now let's add the capability of movement to the agents.
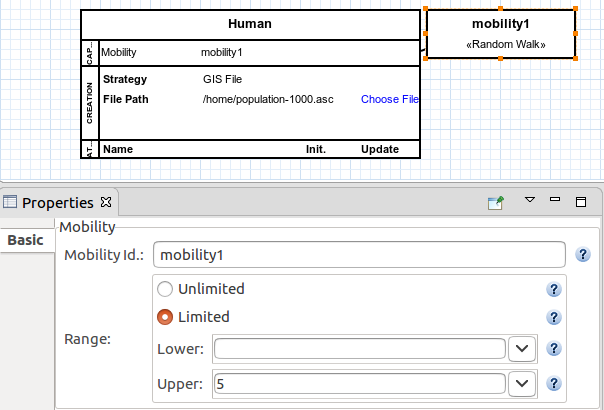
Select an mobility to add, by clicking on the Mobility > "Random Walk" line on the palette and clicking on the agent box.
A new box will be added to the diagram, notice that it is connected to the agent.
Now let's allow the agents to move to the limits of their field of vision on each step of the simulation.
To do this, on the properties view that appeared, "Range" rectangle, check the "Limited" dot and on the "Upper" field set the value to 5.
The resulting box and properties view will look like Fig. 3.
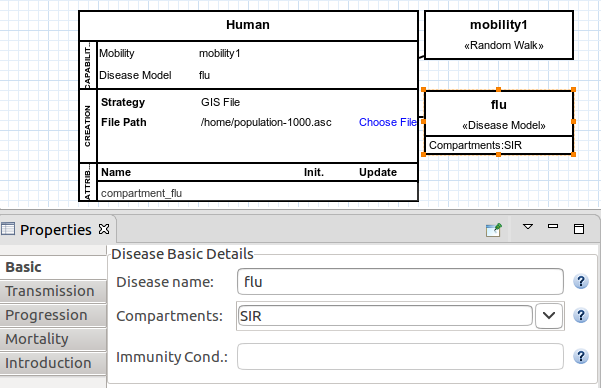
Now let's add the disease capability to allow the agents to get infected by the disease. Select a disease to add, by clicking on the Diseases > "Disease Model" line on the palette and clicking on the agent box.
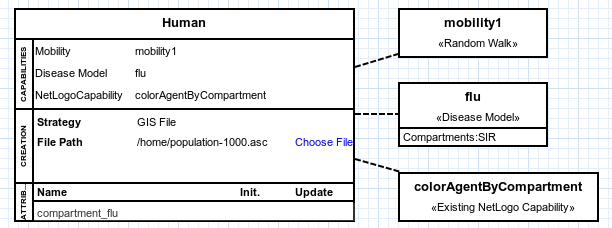
Select the disease box created. On the "Basic" properties view that appeared, change the disease name to "flu" and the "Compartments" combo box to "SIR".
The resulting disease box and basic properties will look like Fig. 4.
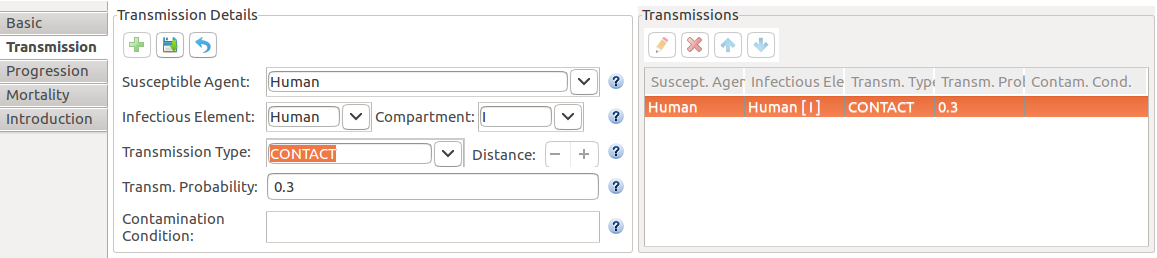
Change to the "Transmission" tab. Click on the "+" button to add a form of transmission to the disease.
On the field "Susceptible Agent" select the created agent's name.
On the field "Infectious Element" select the created agent's name again.
On the field "Compartment" select the "I" compartment, the agents that can transmit the disease to others are the infected ones.
Set the field "Transmission Type" to CONTACT and the field "Transmission Probability" to 0.3. The probability of transmission on contact will be 30%.
Click on the floppy disc button to save the changes.
Select the line created on the right column of the properties view and click on the pencil button, the resulting "Transmission" tab will look like Fig. 5.
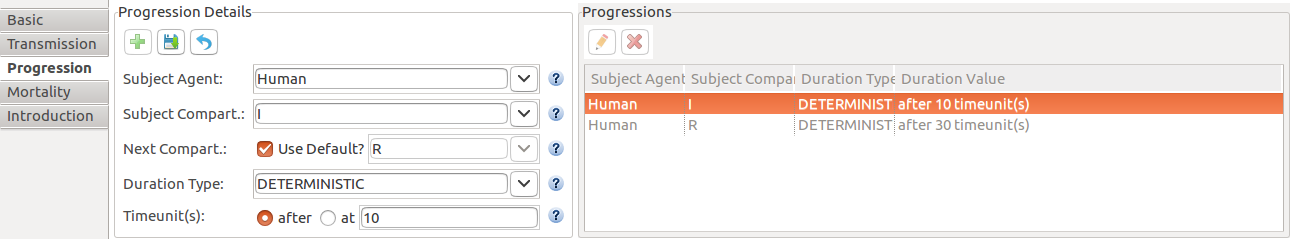
Change to the "Progression" tab. Click on the "+" button to add a disease progression to the agents.
On the field "Subject Agent" select the created agent's name.
On the field "Subject Compartment" select the "I" compartment.
On the field "Next Compartment" mark "Use Default?".
Set the field "Duration Type" to DETERMINISTIC and the "Time unit(s)" to after 10. The infected agents will be recovered from the disease after 10 time units.
Click on the floppy disc button to save the changes.
Select the line created on the right column of the properties view and click on the pencil button, the resulting "Progression" tab will look like Fig. 6.
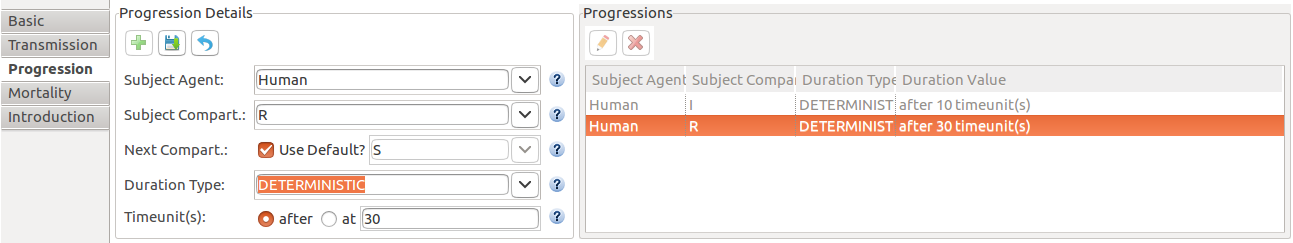
Now let's add a capability to the agent to be susceptible to the disease again after a certain amount of time. On the "Progression" tab. Click on the "+" button to add another disease progression to the agents.
On the field "Subject Agent" select the created agent's name.
On the field "Subject Compartment" select the "R" compartment.
On the field "Next Compartment" mark "Use Default?".
Set the field "Duration Type" to DETERMINISTIC and the "Time unit(s)" to after 30. The recovered agents will be susceptible to the disease again after 30 time units.
Click on the floppy disc button to save the changes.
Select the line created on the right column of the properties view and click on the pencil button, the resulting "Progression" tab will look like Fig. 7.
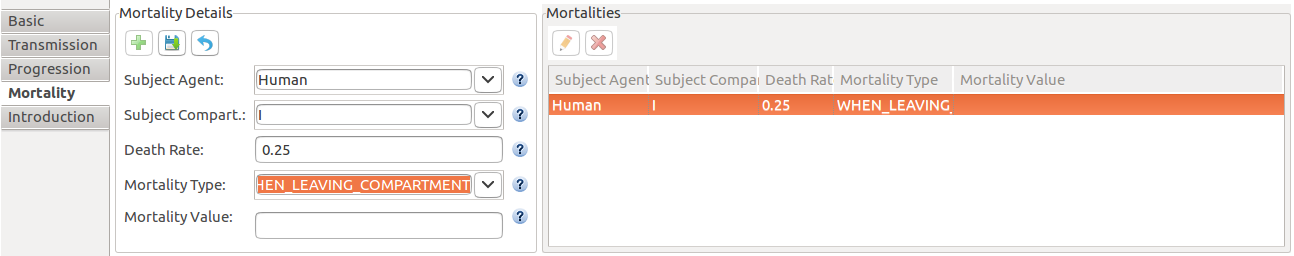
Change to the "Mortality" tab. Click on the "+" button to add a probability of death caused by the disease.
On the field "Subject Agent" select the created agent's name.
On the field "Subject Compartment" select the "I" compartment.
On the field "Death rate" set the value to 0.25. The probability of death will be 25%.
Set the field "Mortality Type" to WHEN_LEAVING_COMPARTMENT. The infected agents might die at the moment they were supposed to change their compartment to recovered.
Click on the floppy disc button to save the changes.
Select the line created on the right column of the properties view and click on the pencil button, the resulting "Mortality" tab will look like Fig. 8.
Change to the "Introduction" tab. On the "Infection Instructions" rectangle, select the first row, Click on the pencil button to choose a few agents to be infected when the simulation begins.
On the "Introduction Details" rectangle, field "Quantity" select DETERMINISTIC and set the number of agents to 10. 10 agents to be infected when the simulation begins.
Click on the floppy disc button to save the changes.
Select the line created on the right column of the properties view and click on the pencil button, the resulting "Introduction" tab will look like Fig. 9.
Now let's add colors to help differentiate infected and recovered agents from each other. To do this, import another file.
Select an existing NetLogo capability to add, by clicking on the External > "Existing NetLogo Capability" line on the palette and clicking on the agent box.
A window where to select the file will be opened. The file is available to download on the link below.
The resulting agent will look like Fig. 10.
Now let's add a graphic to monitor the quantity of the agents according to each compartment at each step of the simulation.
To add the graphic, select one to add, by clicking on the Output > "Output Dataset" line on the palette and clicking anywhere on the diagram.
Select the box created. On the properties view that appeared, focus on the left column.
Choose a name to give to the graphic on the "Name" field. Inside the output rectangle, click on the "+" button.
On the "Name" field, choose a name to identify the line to be added to the graphic. Let's call the first line "susceptible".
Also, choose the entity related to the defined line. On the "Entity" field select the agent created previously.
On the "Criterion" field select "Eligible" and choose the compartment "S". Leave everything else unchanged.
Click on the floppy disc button to save the changes.
Repeat the process above for the "I" and "R" compartments, by adding each with the "+" button.
Select any line created on the right column of the properties view and click on the pencil button, the resulting "Output" properties will look like Fig. 11.
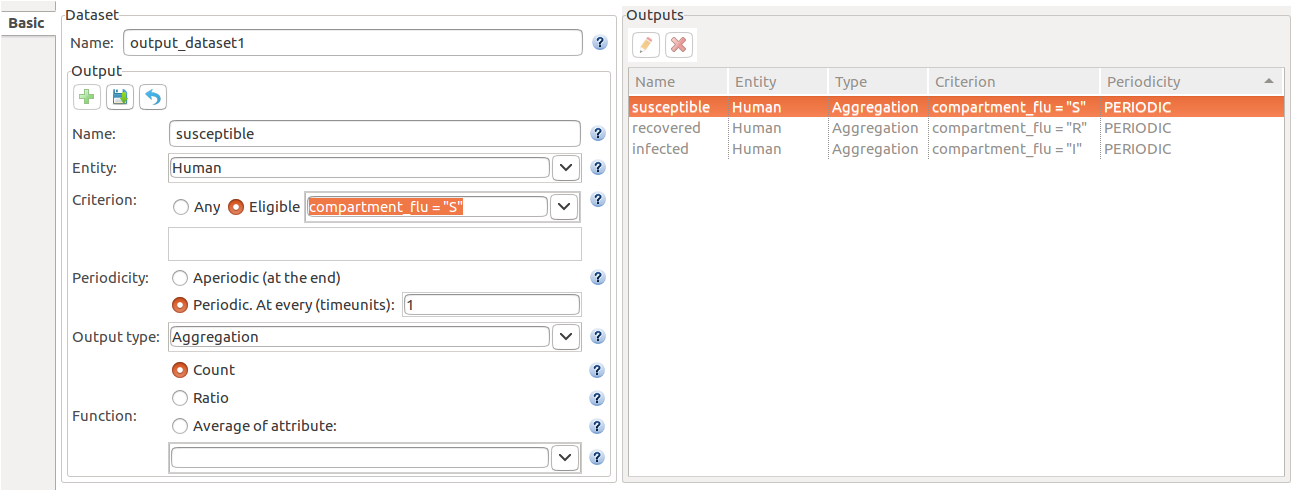
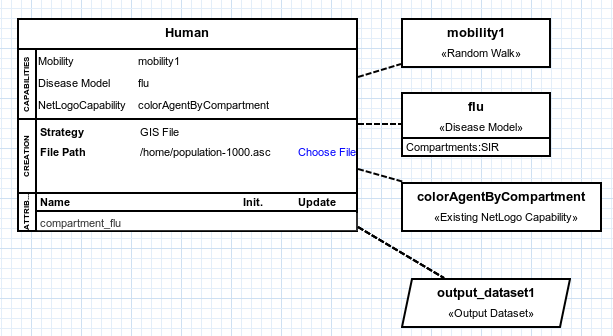
Fig. 12 shows what the entire concern diagram will look like after the changes made in this tutorial.
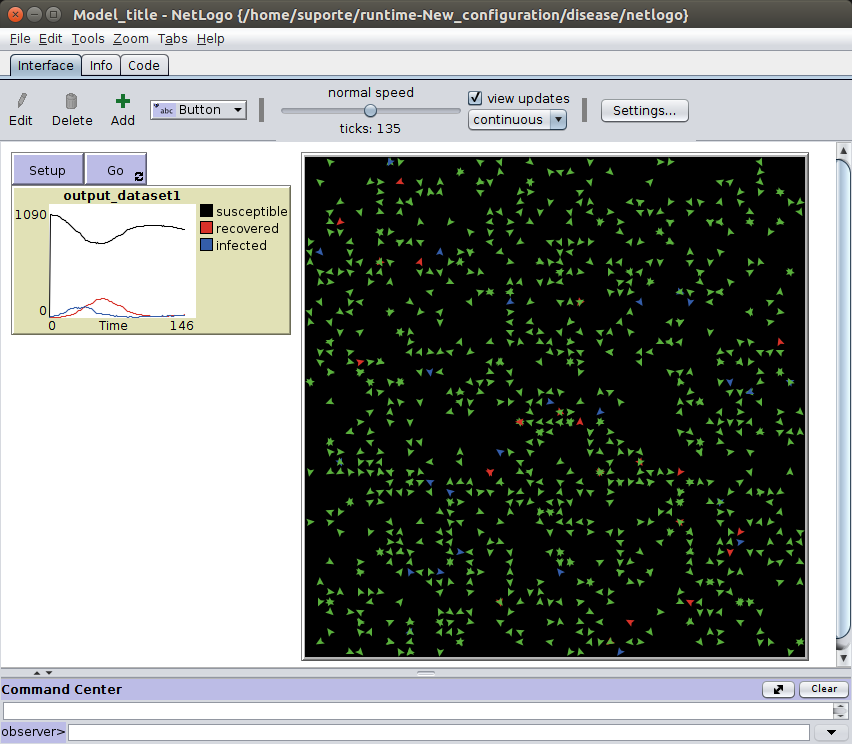
Export and run the simulation on NetLogo, detailed instructions on the link: Exporting the Project to NetLogo.
The simulation will look like Fig. 13.
The complete project created on this tutorial is available to download on the link below.